Handwrite Digits Recognition with k-Means Clustering
Intro
Dataset: data/optdigits.csv source: UCI
- Multiclass
- Image
Import packages
import numpy as np
import pandas as pd
import matplotlib.pyplot as plt

from PIL import Image

from sklearn.cluster import KMeans
from sklearn.preprocessing import Normalizer
from sklearn.model_selection import train_test_split
from sklearn.metrics import confusion_matrix
from sklearn.metrics import accuracy_score
from sklearn.metrics import precision_score
from sklearn.metrics import recall_score
from sklearn.metrics import f1_score
Read dataset
df = pd.read_csv("data/creditcard.csv")

df = pd.read_csv("data/optdigits.csv", header=None)

df.columns = ['p'+str(i) for i in range(64)]+['label']
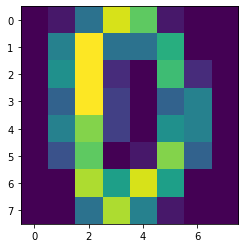
# plot one sample
sample = df.iloc[0][:-1].to_numpy().reshape(8,8)
print("This is",df.iloc[0][-1])
plt.imshow(sample)
This is 0


<matplotlib.image.AxesImage at 0x7f77ae97b850>
Train
# Train test split
train, test = train_test_split(df, train_size = 0.8, test_size = 0.2, random_state=6)
X = train.drop(['label'],axis=1)
y = train.label

# normalize
normalizer = Normalizer().fit(X)
X =  normalizer.transform(X)

# fit training set
model = KMeans(n_clusters=10, random_state=43)
model.fit(X) # matrix, matrix
KMeans(n_clusters=10, random_state=43)
Plot result
fig = plt.figure(figsize=(8, 3))

fig.suptitle('Cluser Center Images', fontsize=14, fontweight='bold')

for i in range(10):

    # Initialize subplots in a grid of 2X5, at i+1th position
    ax = fig.add_subplot(2, 5, 1 + i)

    # Display images
    ax.imshow(model.cluster_centers_[i].reshape((8, 8)), cmap=plt.cm.binary)

plt.show()
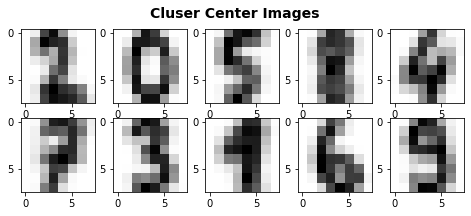
model_label=[2, 0, 5, 8, 4, 7, 3, 1, 6, 9]
Test result
X = test.drop(['label'],axis=1)
y = test.label

# normalize
X =  normalizer.transform(X)

# get prediction
y_pred = model.predict(X)
test['pred'] = [model_label[i] for i in y_pred]


# Score
print('Accuracy:',accuracy_score(y, test.pred))
Accuracy: 0.7947712418300653
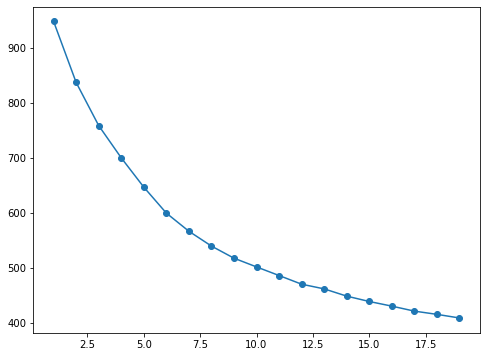
# elbow method
inertia=[]
k_clusters=[]

for k in range(1,20):

    X = train.drop(['label'],axis=1)
    X =  normalizer.transform(X)

    # fit training set
    model_temp = KMeans(n_clusters = k, random_state=43)
    model_temp.fit(X) # matrix, matrix

    inertia.append(model_temp.inertia_)
    k_clusters.append(k)
# draw
plt.rcParams["figure.figsize"] = [8, 6]

plt.plot(k_clusters,inertia, marker='o')
plt.show()
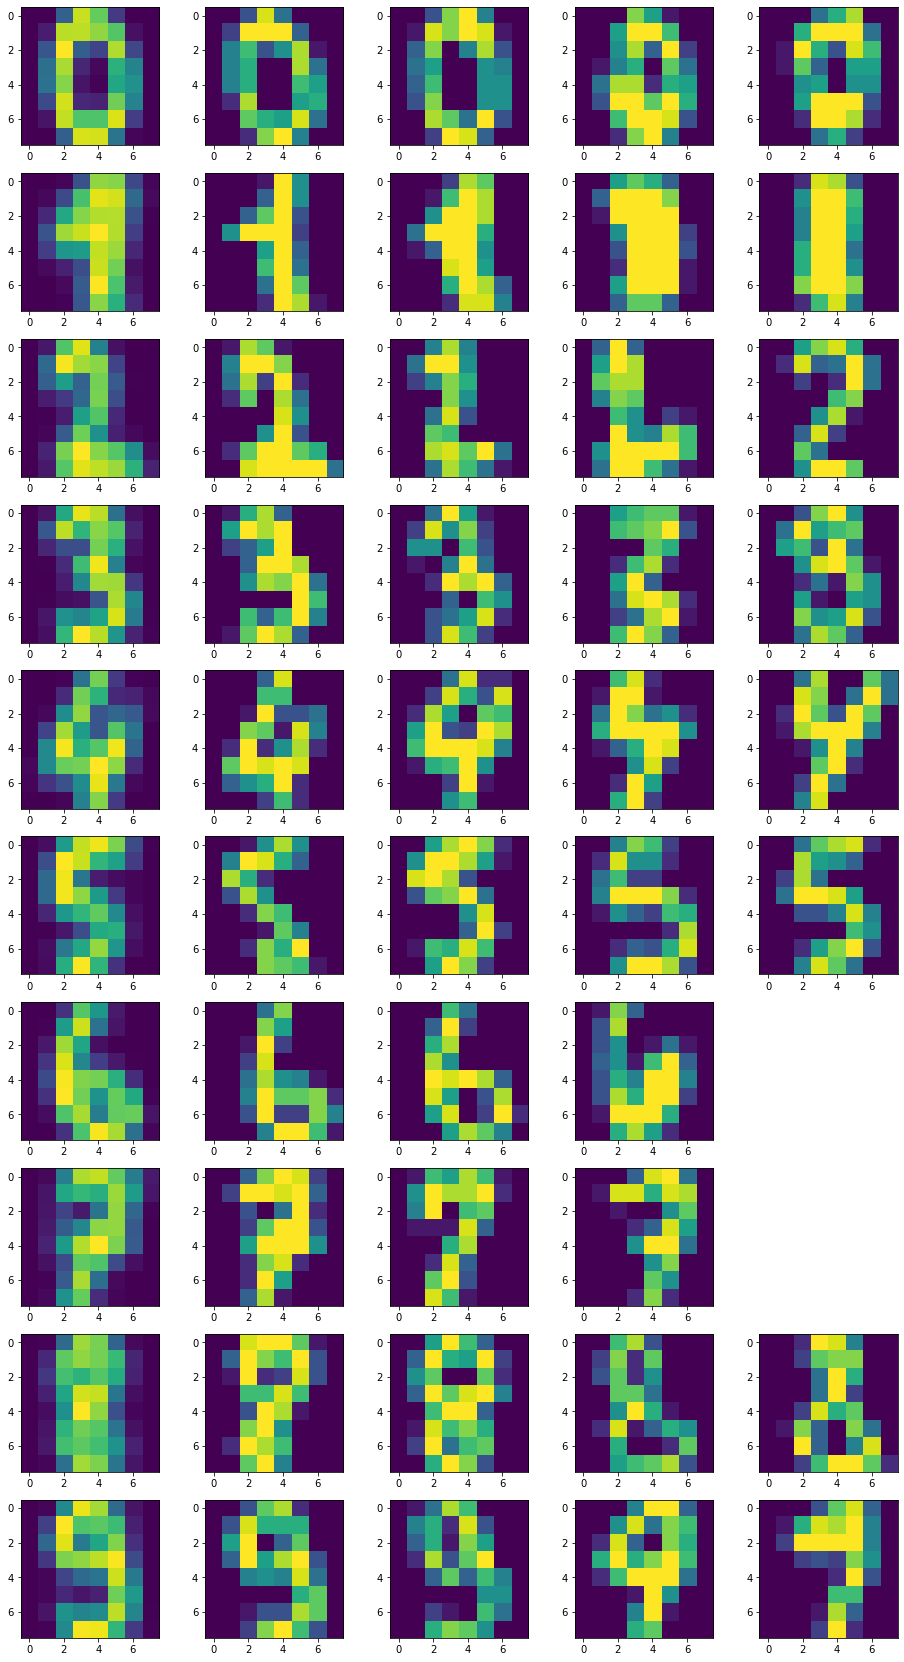
# Error analysis
plt.rcParams["figure.figsize"] = [16, 30]

# i-th digit plot: pixel weight, correct, correct, wrong, wrong
for i in range(0,10):

    data=None
    for j in range(0,10):
        if model_label[j]==i:
            data = model.cluster_centers_[j].reshape((8, 8))

    plt.subplot(10,5,i*5+1)
    plt.imshow(data)

    # plot correct/wrong examples
    t = test[(test.label==i)&(test.pred==i)]
    f = test[(test.label==i)&(test.pred!=i)]
    acc = len(t)/(len(t)+len(f))
    print(i,'digit accuracy:',acc)

    sample = t.iloc[0][:-2].to_numpy().reshape(8,8)
    plt.subplot(10,5,i*5+2)
    plt.imshow(sample)

    sample = t.iloc[1][:-2].to_numpy().reshape(8,8)
    plt.subplot(10,5,i*5+3)
    plt.imshow(sample)

    if acc<1:

        sample = f.iloc[0][:-2].to_numpy().reshape(8,8)
        plt.subplot(10,5,i*5+4)
        plt.imshow(sample)

        if len(f)>1:
            sample = f.iloc[1][:-2].to_numpy().reshape(8,8)
            plt.subplot(10,5,i*5+5)
            plt.imshow(sample)
0 digit accuracy: 0.9759036144578314
1 digit accuracy: 0.2987012987012987
2 digit accuracy: 0.8714285714285714
3 digit accuracy: 0.9066666666666666
4 digit accuracy: 0.8051948051948052
5 digit accuracy: 0.7532467532467533
6 digit accuracy: 0.9863013698630136
7 digit accuracy: 0.9846153846153847
8 digit accuracy: 0.7469879518072289
9 digit accuracy: 0.6705882352941176
Leave a comment